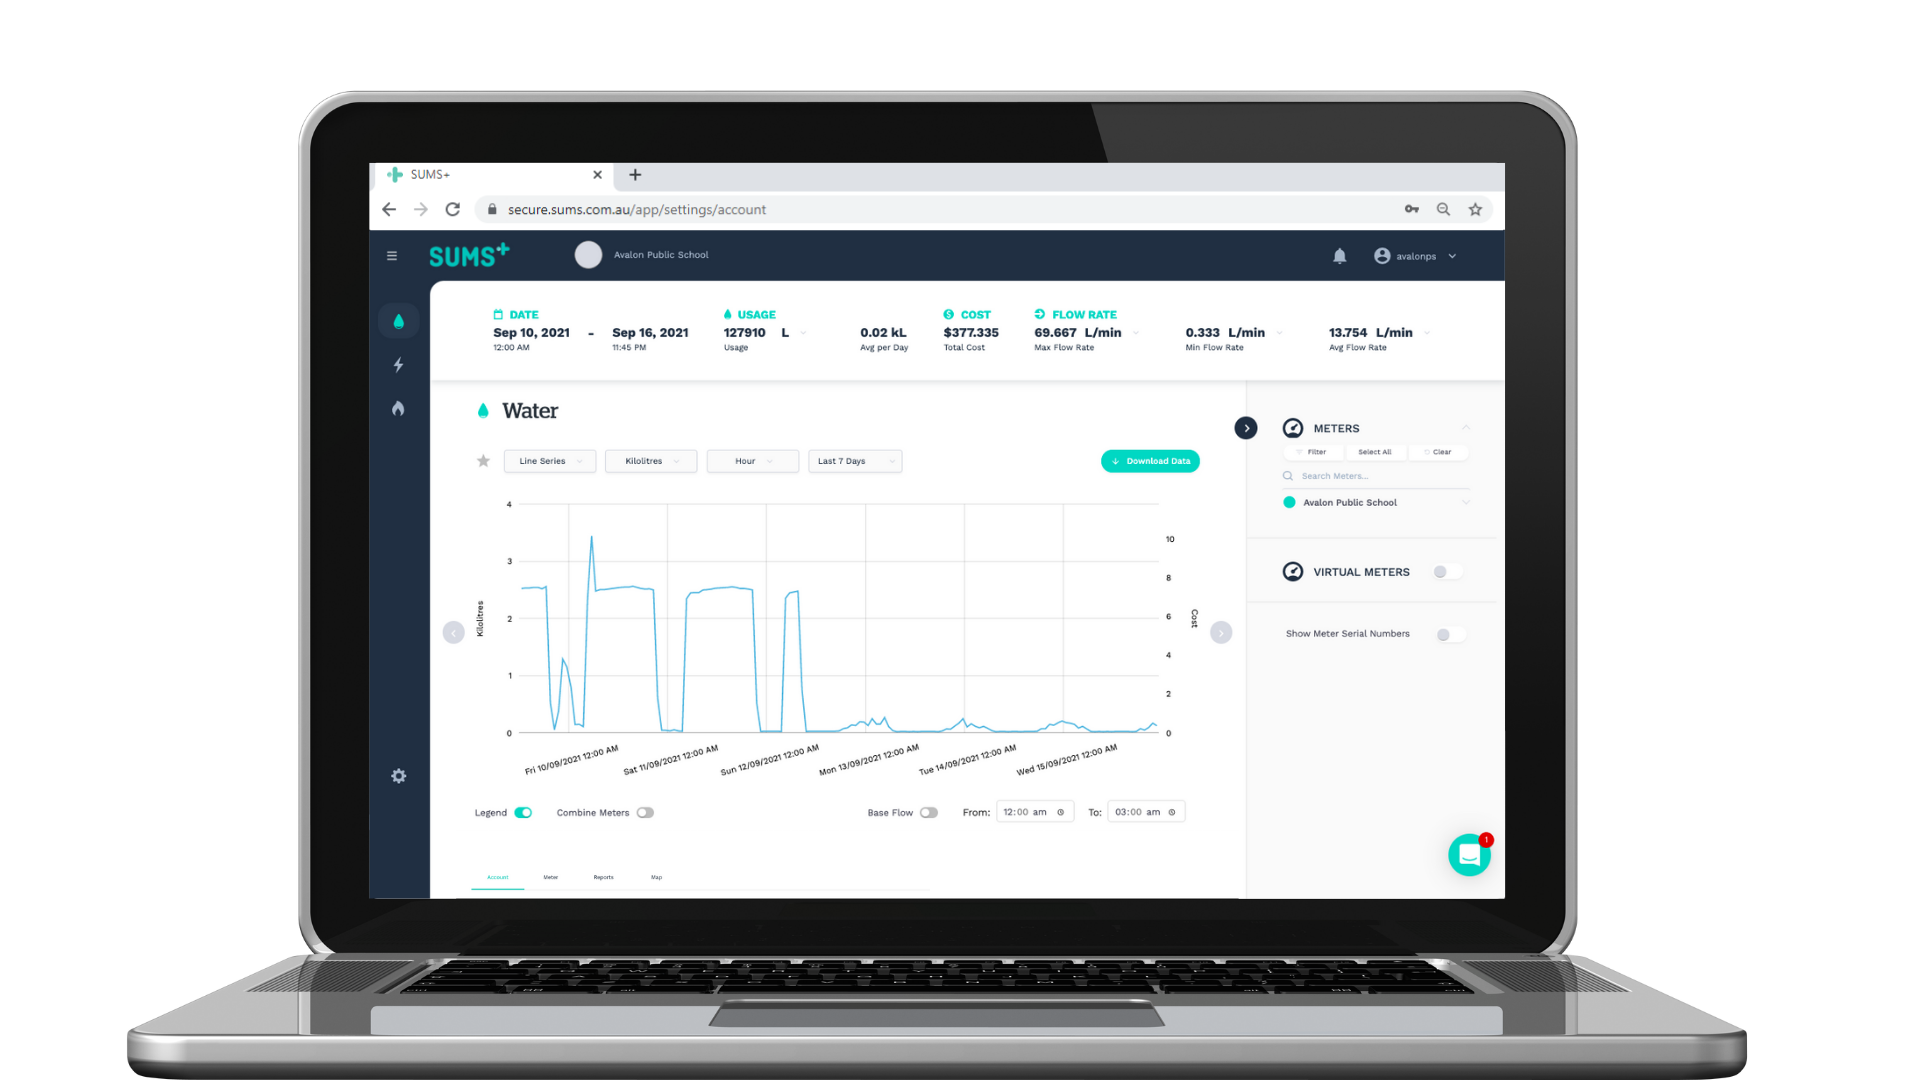
SUMS+ Portal
15-minute interval data, visualised – Gain a holistic view of input and output usage across the site with time of use data available in near real time. The granularity of data makes it possible to recognise abnormal usage patterns and determine where and when it occurred, so the operations can find out why.
Customisable alerts sent via email or SMS – Set alerts to quickly address water and energy spikes, or to be notified of reaching threshold targets, making it easier to proactively manage progress towards reduction targets.
Suite of analysis tools – Added features like base flow, max demand and KPI tracking make it easier to identify problems areas and inefficiencies in normal trends, so regular usage patterns can be adjusted.


 Leading ASX listed real estate & property companies use our smart solutions.
