This drop-down box is located between ‘Chart Period’ and ‘Interval’ directly under the displayed chart. The chart is automatically updated when the graph units are changed.
The usage graph can be displayed as 5 different metrics:
Margrethe Ingemann

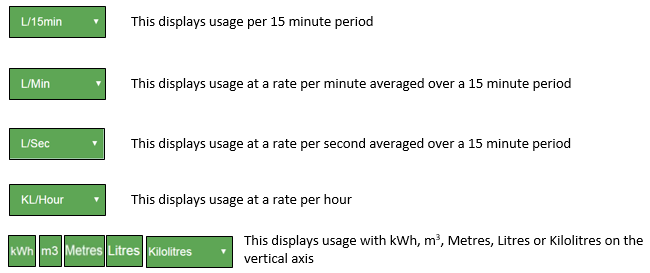
This drop-down box is located between ‘Chart Period’ and ‘Interval’ directly under the displayed chart. The chart is automatically updated when the graph units are changed. The usage graph can be displayed as 5 different metrics:
This drop-down box is located between ‘Chart Period’ and ‘Interval’ directly under the displayed chart. The chart is automatically updated when the graph units are changed.
The usage graph can be displayed as 5 different metrics:
Margrethe Ingemann