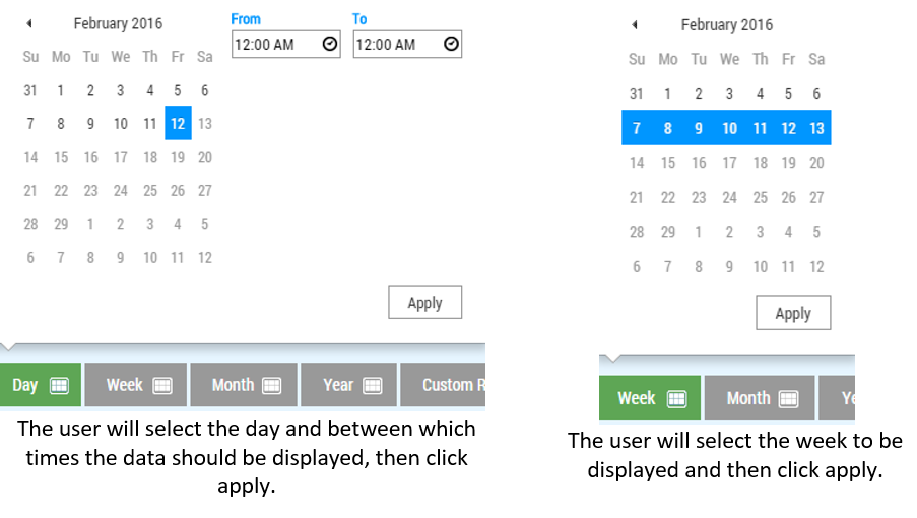
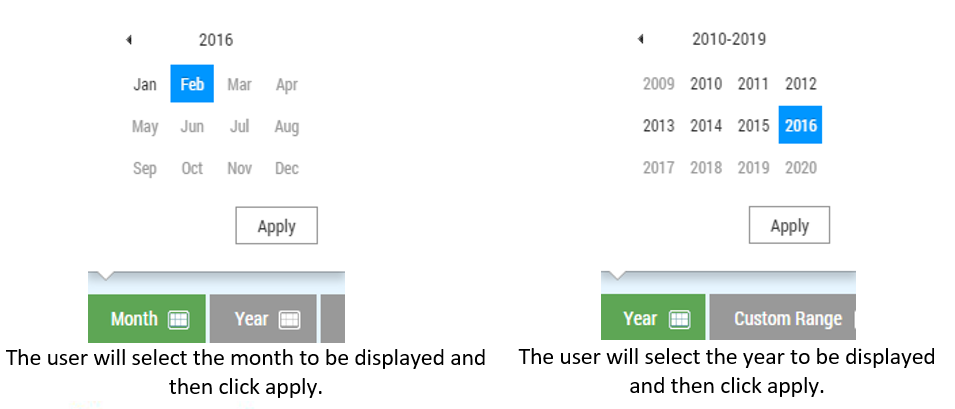
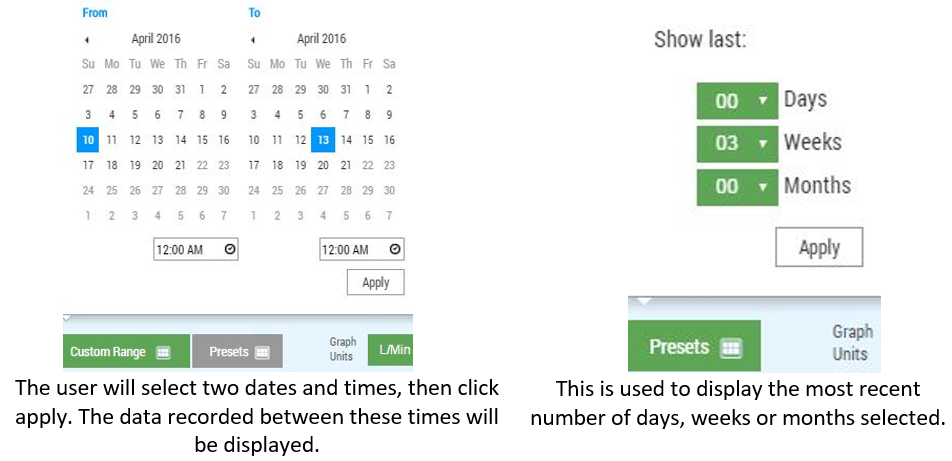
The chart period options are located directly below the chart area. These options adjust the period of time being graphed. If day, week, month or year is selected; the user will then be prompted to select the specific period. See examples below:
Margrethe Ingemann
