VIDEO: Base Flow Explained
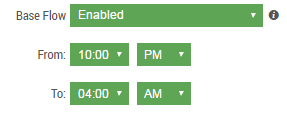
The base flow function can be used to visually represent constant underlying flow (where there should be zero flow). This takes the average flow rates for the given time period and extends that across the selected interval. The base flow can be enabled/disabled and the time period set at the bottom of the main page, see below:
The selected time period should be when the least amount of usage is occurring, usually overnight.

See below an example of base flow displayed across a meter, the constant underlying flow of SmartSchool’s Main Meter is 9.45L/Min. The base flow is the straight horizontal line.


